RESTAURANT ECONOMICS: THE OPERATIONAL TURNAROUND MANUAL
By Ralph Viola Jr.
A Battle-Tested Blueprint for Line Logistics, Financial Engineering, and Concept Optimization
Prepared for Industry Professionals and Turnaround Specialists TEASER EDITION FREE
Published May 2026
CHAPTER 1: THE BROKEN BLUEPRINT OF MODERN FOODSERVICE
The contemporary restaurant environment operates under severe structural stress. The traditional operational approach, which assumes that high culinary quality combined with basic hospitality ensures commercial profitability; is fundamentally obsolete. According to macro industry insights published by the National Restaurant Association, the financial tolerance for operational errors has contracted to zero.
The Standard Dollar Breakdown (Industry Medians [Ref 1]):
Every single dollar of generated restaurant revenue is aggressively consumed by fixed and variable overhead before net returns can be realized:
– Food and Beverage Cost: 30 Cents
– Labor and Payroll: 30 Cents
– Rent and Occupancy: 10 Cents
– Utilities, Marketing, and Administration: 21 Cents
– Baseline Net Profit: 9 Cents (Optimal Maximum)
This macro environment yields an industry-wide average net profit margin ranging strictly between 3 percent and 9 percent [Ref 1]. Full-service establishments systematically hover near the lower 3 percent boundary, while fast-casual formats perform closer to the upper limits due to reduced staffing overhead. Concurrently, the industry experiences a standard first-year failure rate of approximately 60 percent. By the fifth year of continuous operation, roughly 80 percent of independent restaurant locations permanently cease operations.
The Hard Financial Thresholds:
To survive, an operation must keep its combined Prime Cost (total food cost added to total labor cost) at or below 60 percent of gross revenue. Exceeding a 60 percent prime cost represents a direct warning sign of imminent financial collapse. Full-service dining rooms require an average revenue generation of 150 dollars to 300 dollars per seat, per day, assuming two to three full table turns, to withstand fixed occupancy costs.
CHAPTER 2: THE THIRD-VISIT RETENTION RULE
Statistical breakdowns compiled across nationwide restaurant systems confirm that 48 percent of all independent restaurant failures stem directly from a critical structural deficiency: the inability to secure repeat guests [Ref 1]. Broad-spectrum marketing campaigns focused on acquiring new patrons systematically bleed capital because single-visit diners fail to offset original marketing costs.
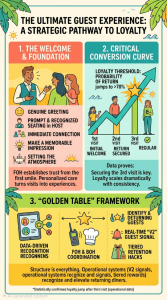
The Conversion Probability Continuum:
A consumer’s relationship with a restaurant concept changes dramatically based on their visit frequency. The probability metrics clarify exactly where marketing dollars are won or lost:
– The First-Time Guest: Holds a baseline 40 percent probability of returning for a secondary visit. This represents an unhedged acquisition expense.
– The Second-Time Guest: The statistical needle remains stagnant, holding at a 42 percent probability of returning for a third visit.
– The Third-Visit Threshold: Once a guest is successfully driven to cross the threshold of a third distinct visit, the mathematical probability of a fourth return surges to over 70 percent. At this precise volume, the consumer transitions into a permanent regular and brand advocate.
The Cost-of-Goods-Sold (COGS) Conversion Math:
Operational data demonstrates that spending targeted product cost directly on a second-visit diner yields the highest return on investment available in modern hospitality:
– Average Guest Ticket Total: $45.00
– Raw Back-of-House Product Cost for V2 Intercept Bite: $1.50
– Targeted Conversion Frequency Per Annum: 12 Visits
– Transformed Customer Lifetime Value (LTV): $540.00
Allocating a minute fraction of raw food cost to execute an internal table intercept is exponentially more efficient than deploying standard external media advertisements.
The Mid-Course Intercept Protocol:
Turnaround specialists implement a rigid, automated trigger to lock in this 70 percent retention rate in real time:
1. System Identification: Point of Sale profiles or manual host tracking tags tables before entrees are fired using a clear ticket modifier: V2 / SECOND VISIT.
2. Kitchen Execution: The expediter prioritizes the ticket line. Before main dishes drop, the line fires a low-labor, highly specialized chef’s bite (e.g., house-cured protein or distinct artisan appetizer) delivered directly to the table.
3. Front-of-House Reinforcement: The floor manager executes a targeted table touch, referencing specific preferences or items ordered during their prior visit to eliminate transactional distance.
4. The Retention Bounce-Back: At final settlement, the server delivers a personalized incentive tailored to the guest’s noted tastes, valid exclusively for a 14-to-21-day window to force rapid behavioral habituation.
CHAPTER 3: DECONSTRUCTING THE PRIMARY DRIVERS OF FAILURE
To execute a comprehensive turnaround, an operational consultant must isolate, audit, and systematically repair the primary catalysts of venue bankruptcy revealed by macro industry audits.
1. Poor Location Realities (79% Impact [Ref 1])
Location deficiencies represent the single greatest threat to traffic velocity, impacting 79 percent of distressed operations. High rent coupled with low organic visibility creates an insurmountable financial drag. When a turnaround consultant is chained to a compromised geographic footprint, the resolution requires shifting from generic local promotion to aggressive, high-margin catering models and off-premise corporate delivery frameworks that bypass physical street-view limitations.
2. Under-Capitalization Pitfalls (72% Impact [Ref 1])
Nearly three-quarters of failing venues launch without sufficient working capital reserves to withstand the initial cash-bleed phase. Operators exhaust their resources on front-of-house aesthetics while starving the back-of-house infrastructure. Turnaround specialists address under-capitalization by instantly cutting non-essential administrative spending, renegotiating distributor payment terms, and liquidating dead stock to restore immediate liquidity.
3. Arbitrary Menu Pricing Errors (65% Impact [Ref 1])
Sixty-five percent of struggling operators calculate menu prices using unverified industry assumptions rather than precise recipe cost cards. When raw commodity costs spike violently—as seen in global beef, poultry, and dairy markets [Ref 2]—margins collapse instantly behind the line.
The solution requires rigorous Menu Matrix Engineering. Items must be classified according to empirical performance data:
– Stars: High profitability, high popularity. These items must be prominently positioned in the top-right focal zones of the physical menu layout.
– Plowhorses: Low profitability, high popularity. These items must be systematically re-engineered by adjusting portion sizes, altering secondary ingredients, or combining them with low-cost, high-margin starch pairs.
– Puzzles: High profitability, low popularity. The service staff must be incentivized to actively upsell these items through targeted floor competitions.
– Dogs: Low profitability, low popularity. These elements must be stripped from the prep schedule immediately to eliminate line drag and inventory rot.
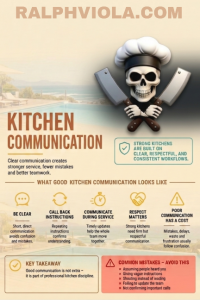
CHAPTER 4: SOLVING THE LABOR CRISIS THROUGH LINE LOGISTICS
With staff turnover rates averaging an unsustainable 75 percent annually across the culinary sector [Ref 1, Ref 2], traditional station management models are broken. The financial cost of losing a single experienced back-of-house team member sits at an estimated median of 5,864 dollars. Finding and retaining qualified talent represents a continuous operational bottleneck.
Station Ergonomics and Footstep Auditing:
The modern turnaround specialist views labor not as a fixed schedule expense, but as a variable of physical motion. When a kitchen line is poorly organized, cooks must take excessive steps to compile a plate. This structural inefficiency causes severe ticket delays, drops customer satisfaction, and spikes total payroll hours.
Consultants restructure physical kitchen lines to allow a highly trained, specialized skeleton crew of three line cooks to smoothly execute volume that previously required five unorganized bodies. Every single high-volume ingredient must be placed within a strict 180-degree pivot radius of the cook’s primary cooking position, completely eliminating footsteps during peak rushes.
The Third-Party Platform Margin Squeeze:
Digital delivery platforms routinely charge a 15 percent to 30 percent commission on every ticket [Ref 1], completely erasing standard restaurant profit margins. To preserve cash flow, consultants enforce distinct dual-pricing strategies: raising menu prices on third-party applications to absorb the platform cut, while offering exclusive incentives for direct, in-house ordering.
CHAPTER 5: THE TECH MATURITY TURNAROUND BLUEPRINT
A profound operational chasm separates high-performing corporate chains from struggling independent operators. While corporate groups utilize automated data models to predict ingredient demand, manage inventory, and optimize labor schedules, independent operators frequently manage food costs using primitive manual methods.
Eliminating the Manual Clipboard System:
Relying on manual clipboard tracking causes significant delays in identifying food waste and tracking price inflation. Turnaround specialists systematically remove manual inventory habits and deploy modern, integrated cloud-based inventory systems. These tools link directly to real-time supplier invoices via automated optical character recognition scanning. If the wholesale price of a core protein increases by even a minor percentage, the system immediately flags the margin compression before the next ordering cycle occurs.
Predictive Supply Chain and Waste Minimization:
By connecting historical point-of-sale volume metrics directly with local meteorological forecasts and seasonal patterns, advanced scheduling software allows operators to build precise, predictive prep sheets. Kitchen teams prepare exactly what the data dictates will sell over the next 24 hours, preventing over-preparation and stopping high-value raw ingredients from being discarded directly into the kitchen waste bins. An optimized tech stack also directly enhances digital reputation; data compiled by Cornell University indicates that a single-star improvement on verified consumer review platforms yields a direct 5 percent to 9 percent lift in gross top-line revenue [Ref 3].
REFERENCES AND INDUSTRY DATA SOURCES
[Ref 1] National Restaurant Association State of the Industry Economic Analysis
Source metrics for: Industry median breakdowns (30c food, 30c labor), failure causes (48% no repeat guests, 79% location, 72% under-capitalization, 65% pricing), and the 3-9% average net margin threshold.
URL: https://restaurant.org/research-and-media/media/press-releases/
[Ref 2] Toast POS Industry Trends and Labor Turnover Benchmarks
Source metrics for: The 75%+ annual kitchen staff turnover rates and the average $5,864 separation and replacement cost per employee departure.
URL: https://pos.toasttab.com/news/restaurant-industry-report/
[Ref 3] Cornell University Center for Hospitality Research Valuation Frameworks
Source metrics for: The 5% to 9% top-line revenue lift directly correlated to verified customer review rating increases and daily seat revenue target dynamics ($150-$300).
URL: https://sha.cornell.edu/centers-institutes/chr/
Free PDF: RESTAURANT ECONOMICS: THE OPERATIONAL TURNAROUND MANUAL
Receiving Inspection: 8 Checks That Prevent 80% of Problems
More to come in complete guide.
2 thoughts on “Restaurant Economics: The Operational Turnaround Manual”