
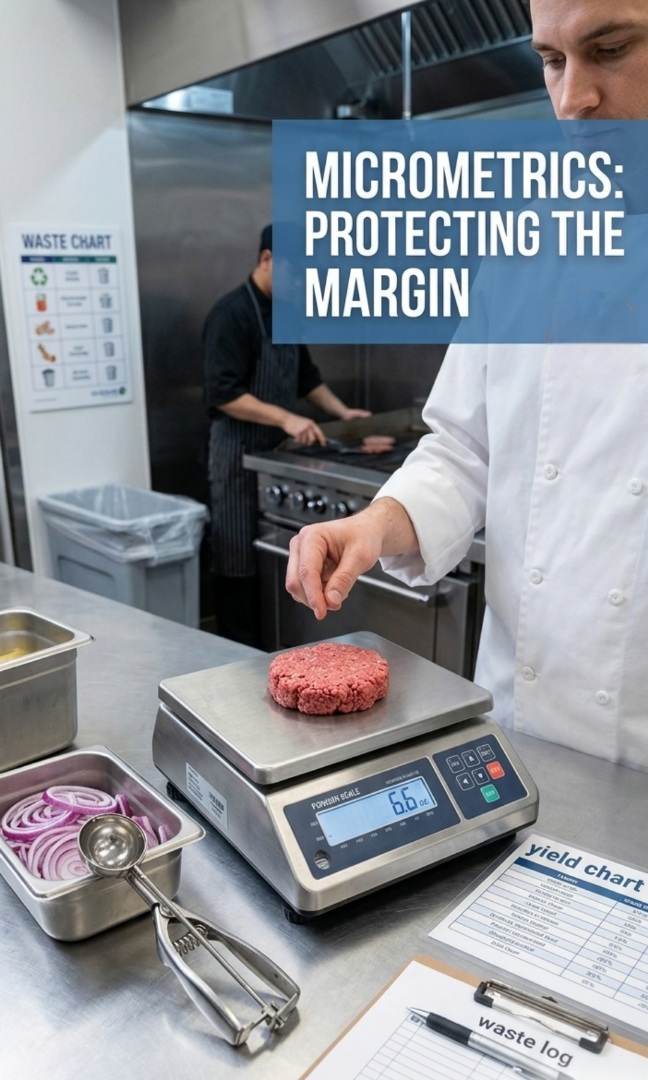
Micro Metrics and the Reality of Restaurant Profit Margins
When analyzing restaurant profitability, looking at a monthly profit and loss statement is never enough. True financial control happens at the granular level where small points of friction dictate whether an operation thrives or folds. In a high volume kitchen, small fractions of a dollar compounded hundreds of times a day determine the ultimate bottom line.
The Reality of Yield Percentages
Food cost control does not begin on the line. It starts at the prep table. When purchasing raw ingredients or whole primals, the theoretical cost is calculated based on total usability. Yield testing measures the actual usable product after processing.
If a prep cook is careless while trimming fat, silverskin, or connective tissue, a ninety percent expected yield can easily drop to eighty percent. On a high cost protein, losing ten percent of the yield directly spikes the actual plate cost before a single order is ever fired. Tracking yield percentages on highest velocity prep items is essential for maintaining accurate theoretical food cost numbers.
Theoretical versus Actual Food Cost Variance
Managing food cost effectively requires understanding the gap between expectation and reality.
Theoretical food cost represents what the food cost should be based on current recipes, portion sizes, and vendor invoice pricing, assuming zero waste, zero comps, and perfect execution.
Actual food cost represents what was actually spent based on opening inventory, current purchases, and closing inventory.
The difference between these two figures is the variance. In a tightly run kitchen, that variance should remain under one percent. A wider gap indicates an operational leak, meaning product is being lost to unlogged waste, over portioning, kitchen errors, or theft.
The Financial Impact of Minor Over Portioning
Minor errors in portion control scale rapidly over time. Consider a busy line cook who does not use a portion scoop or scale, grabbing an extra half ounce of a standard ingredient out of habit or speed during a rush. If that half ounce equates to roughly ten cents, the financial slide accelerates quickly.
At two hundred plates per day, that minor oversight costs twenty dollars daily. Over a single week, the loss reaches one hundred forty dollars. Over the course of a year, that single over portioned ingredient wipes more than seven thousand dollars directly off the net profit. Multiplying that error across multiple line items demonstrates how quickly a restaurant can bleed capital.
Waste Logs as an Accountability Tool
A kitchen operating without a strictly enforced waste log is operating blind. Every dropped line item, over prepped batch of product that spoils, or burnt tray of prep must be physically recorded with a quantity, reason, and the initials of the employee responsible.
This practice shifts accountability. When staff members must physically document mistakes, it changes daily behavior. Waste moves from an abstract cost of doing business to a tangible metric that management can review weekly to identify specific training gaps or over prepping trends.
Labor Efficiency and Time Management
Managing labor metrics is not about cutting staff early and leaving the kitchen short handed during a rush. It is about scheduling to the actual labor curve and maintaining clock discipline.
If multiple back of house staff members clock in fifteen minutes earlier than scheduled or drag out cleanup for fifteen minutes past their shift every day, unearned labor expenses accumulate. At modern industry wage averages, this minor daily leakage can easily add hundreds of dollars in unnecessary expenses each month. Tracking items prepped per labor hour clarifies whether the prep team is running at peak efficiency or if the schedule needs adjustment to match historical prep to sales ratios.
Engineering the Operational System
Sustaining these metrics requires building accountability into the physical layout of the kitchen. Telling a team to watch their portions is rarely effective on its own. Instead, anchor the correct portion scoops to the line coolers, position digital scales next to protein drawers, post visual yield charts above prep tables, and secure the waste log in a highly visible location next to the kitchen trash cans. When the correct operational behavior requires the least amount of resistance, the micro metrics naturally take care of themselves.
Common Kitchen Mistakes That Ruin Good Food